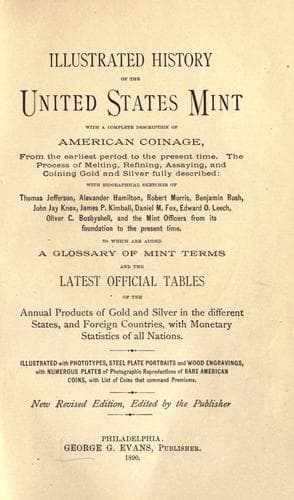
Illustrated history of the United States mint: with a complete description of American coinage, from the earliest period to the present time
History
Illustrated history of the United States mint: with a complete description of American coinage, from the earliest period to the present time
Coinage -- United States; Mints -- United States
At the beginning of the fiscal year 1887 there was on hand at the mints
at Philadelphia, New Orleans and San Francisco, silver bullion purchased
for the silver dollar coinage amounting to $2,960,969.02. There was
delivered at the mints on purchases of all kinds during the year, as
above, 29,433,342.27 standard ounces, at a cost of $25,988,620.46,
making the total amount of silver available during the fiscal year
for the silver dollar coinage 32,691,837.93 standard ounces, costing
$28,949,589.48.
The price paid by this Bureau on November 1, 1887, for silver purchases
for the silver dollar coinage was $0.9580.80 per ounce fine.
The production of silver, notwithstanding the large depreciation in the
market value of that metal, has steadily increased from $115,000,000
in 1883 to $130,000,000 in 1886. The production of the world for the
calendar years 1883, 1884, 1885 and 1886 is exhibited in the following
table:
World’s Production of Gold and Silver.
---------+-----------------------+------------------------
| Gold. | Silver.
Calendar +----------+------------+----------+-------------
Years. |Kilograms.| Value.[23] |Kilograms.| Value.[24]
---------+----------+------------+----------+-------------
1883 | 143,533 | $95,392,000| 2,769,197| $115,088,000
1884 | 153,017 | 101,694,000| 2,804,725| 116,564,000
1885 | 154,942 | 102,975,000| 3,062,009| 127,257,000
1886 | 147,097 | 97,761,000| 3,137,175| 130,383,000
---------+----------+------------+----------+-------------
The United States still maintains first rank among the nations of the
world as the largest producer of the precious metals, having produced
during the calendar year 1886 gold and silver of the coining value
of $86,000,000. Mexico retains second rank, with a production of
$33,614,000, of which $33,000,000 was silver. Australia has a production
of $27,647,000, of which $26,425,000 was gold. Russia is credited with a
production of $21,046,000, of which $20,518,000 was gold.
Circulation of Standard Silver Dollars at the end of each six months,
from July 1, 1885, to July 1, 1887, and on October 1, 1887.
Public-domain text, read in full here on John Shaqi.
Reviews
Reviews
No reviews yet
Be the first to share your thoughts on this work.
Elsewhere in the archive
Join the Discussion
Join the discussion
Sign in to leave a comment or review.
Sign InorCreate an account