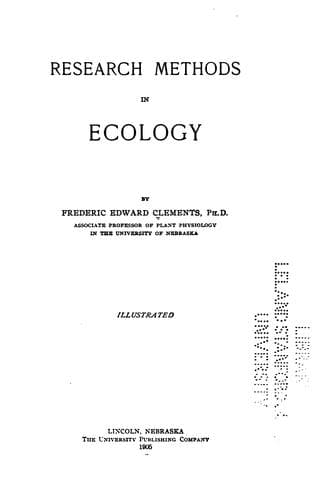
Research methods in ecologyClements, Frederic E. (Frederic Edward)
Science
Research methods in ecology
Clements, Frederic E. (Frederic Edward)
Plant ecology; Plant ecology -- Methodology
=139. Plotting.= The paper employed is divided into centimeter squares
which are subdivided into 2–millimeter units. For ordinary curves the
size of sheet is 9½ × 7¾ inches, which makes it possible for curve
sheets to be filed in the record book. Tablets containing 60 of these
sheets can be obtained for 20 cents each from the Central School Supply
House, Chicago. For curves longer than 9 inches special sizes of sheets
must be used. On account of their inconvenience large sheets are avoided
whenever possible. This can usually be accomplished by increasing the
numerical value of the intervals. The inks employed in plotting are the
waterproof inks of Chas. Higgins & Co., Brooklyn, New York. These are
made in ten or more colors, black, violet, indigo, blue, green, yellow,
orange, brown, brick red, carmine, and scarlet, and cost 25 cents per
bottle. In addition to being waterproof, they make it possible to
combine curves in all conceivable ways without destroying their
identity. Furthermore, it is a great advantage to use the same color
invariably for the same kind of curve: thus, it has been the practice to
indicate the 3–foot, surface, 5, 10, and 15–inch temperature curves by
violet, green, yellow, blue, and carmine respectively. A fine-pointed
pen, such as the Spencerian No. 1, is most satisfactory for inking;
drawing pens, such as Gillott’s Crowquill, are too finely pointed for
ordinary use.
In plotting a curve, it is first necessary to determine the value of the
interval, and the extreme range of the curve or combination. For
example, in the case of temperature, it is most convenient to assign a
value of 1° Centigrade to each centimeter, since the thermometers used
read to one-fifth of a degree, which corresponds exactly to the
2–millimeter units of each square. The length of the sheet permits a
range of 22 degrees Centigrade, and the actual limits must be determined
for the particular results to be employed. For the same region, it is
very desirable that the unit interval and the range be the same, in
order that all curve sheets may admit of direct comparison. Indeed, it
is greatly to be hoped that in the future ecologists will agree to a
uniform system of curve-plotting, cartography, etc., as the geographers
are beginning to do in the construction of maps. The major intervals are
written, or, better, typewritten, at both sides of the sheet, and the
time or space intervals are indicated at the top. Each curve sheet is
properly labeled, and essential data indicated. The readings are taken
from the field record, and their proper positions indicated by a dot.
These are connected first by a pencil line, the curves being made abrupt
rather than flowing; and the line, after having been carefully checked,
is traced in ink.
Public-domain text, read in full here on John Shaqi.
Reviews
Reviews
No reviews yet
Be the first to share your thoughts on this work.
Elsewhere in the archive
Join the Discussion
Join the discussion
Sign in to leave a comment or review.
Sign InorCreate an account