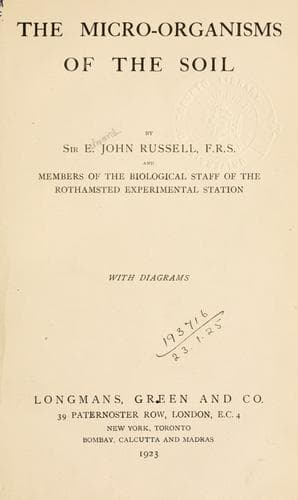
The micro-organisms of the soilRussell, Edward J. (Edward John)
Science
The micro-organisms of the soil
Russell, Edward J. (Edward John)
Soil microbiology
On such a plot it is possible to investigate the rapidity with which
the numbers of the soil micro-organisms alter in point of time. For
example, on the dunged plot of Barnfield, Rothamsted, which has been
cropped with mangolds for forty-seven successive years, the area
distribution of bacteria has been found to be so uniform that if a
number of samples of soil are taken from the plot at the same time, the
difference in bacterial numbers between the samples cannot be detected
by means of the counting technique (see Table V.). The work of Cutler,
Crump, and Sandon[16] on this plot showed that the bacterial numbers
vary very greatly from one day to the next, and that these fluctuations
took place over the whole plot, since two series of samples, taken in
two rows 6 feet apart, showed similar fluctuations (see Fig. 7). The
discovery of these big daily fluctuations in numbers led to an inquiry
as to how quickly bacterial numbers change, and samples from Barnfield,
taken at two-hourly intervals, showed that significant changes in
numbers took place even at such short intervals.
TABLE V.--BACTERIAL COUNTS OF FOUR SOIL SAMPLES.
FROM BARNFIELD, TAKEN SIMULTANEOUSLY.
+------------------------------------------------------+
| Counts of Colonies on each Plate. |
+------+-----------+-----------+-----------+-----------+
|Plate.| Sample I. | Sample II.|Sample III.| Sample IV.|
+------+-----------+-----------+-----------+-----------+
| 1 | 38 | 45 | 43 | 27 |
| 2 | 32 | 40 | 34 | 41 |
| 3 | 52 | 45 | 52 | 35 |
| 4 | 32 | 31 | 55 | 36 |
| 5 | 40 | 43 | 38 | 45 |
|Mean | 38·8 | 40·8 | 44·4 | 36·8 |
+------+-----------+-----------+-----------+-----------+
Standard deviation between the four samples = 7·25.
Standard deviation between parallel plates within the sets = 7·55.
[Illustration: FIG. 7.
X-axis (top): Days.
Y-axis (left): (Series A) Bacteria--millions per gramme of soil.
Y-axis (right): (Series B) Bacteria--millions per gramme.
Caption: Daily changes in bacterial numbers in field soil.
Counts from two series of soil samples taken 6 feet apart.
(After Cutler.)]
Public-domain text, read in full here on John Shaqi.
Reviews
Reviews
No reviews yet
Be the first to share your thoughts on this work.
Join the Discussion
Join the discussion
Sign in to leave a comment or review.
Sign InorCreate an account